Elections
Can consumption Theory be applied to a partial segment of the population? In 2016, I did a chart showing the effect of rural voters income as percentage of disposable personal income and it did show that the up and down of this ratio having an effect on U.S. presidential elections. After Trump II election, I revised the chart to include data back to 1959 and it shows that in 15 out of 17 times the election could be explained by farm income. Furthermore, political affiliation did not determine the result of elections, only the farm income! This behavior confirms voters' self interest, i.e. preference for policies that increase farm income, as motivator for elections, which is a plus for the micro foundations of the consumption theory!
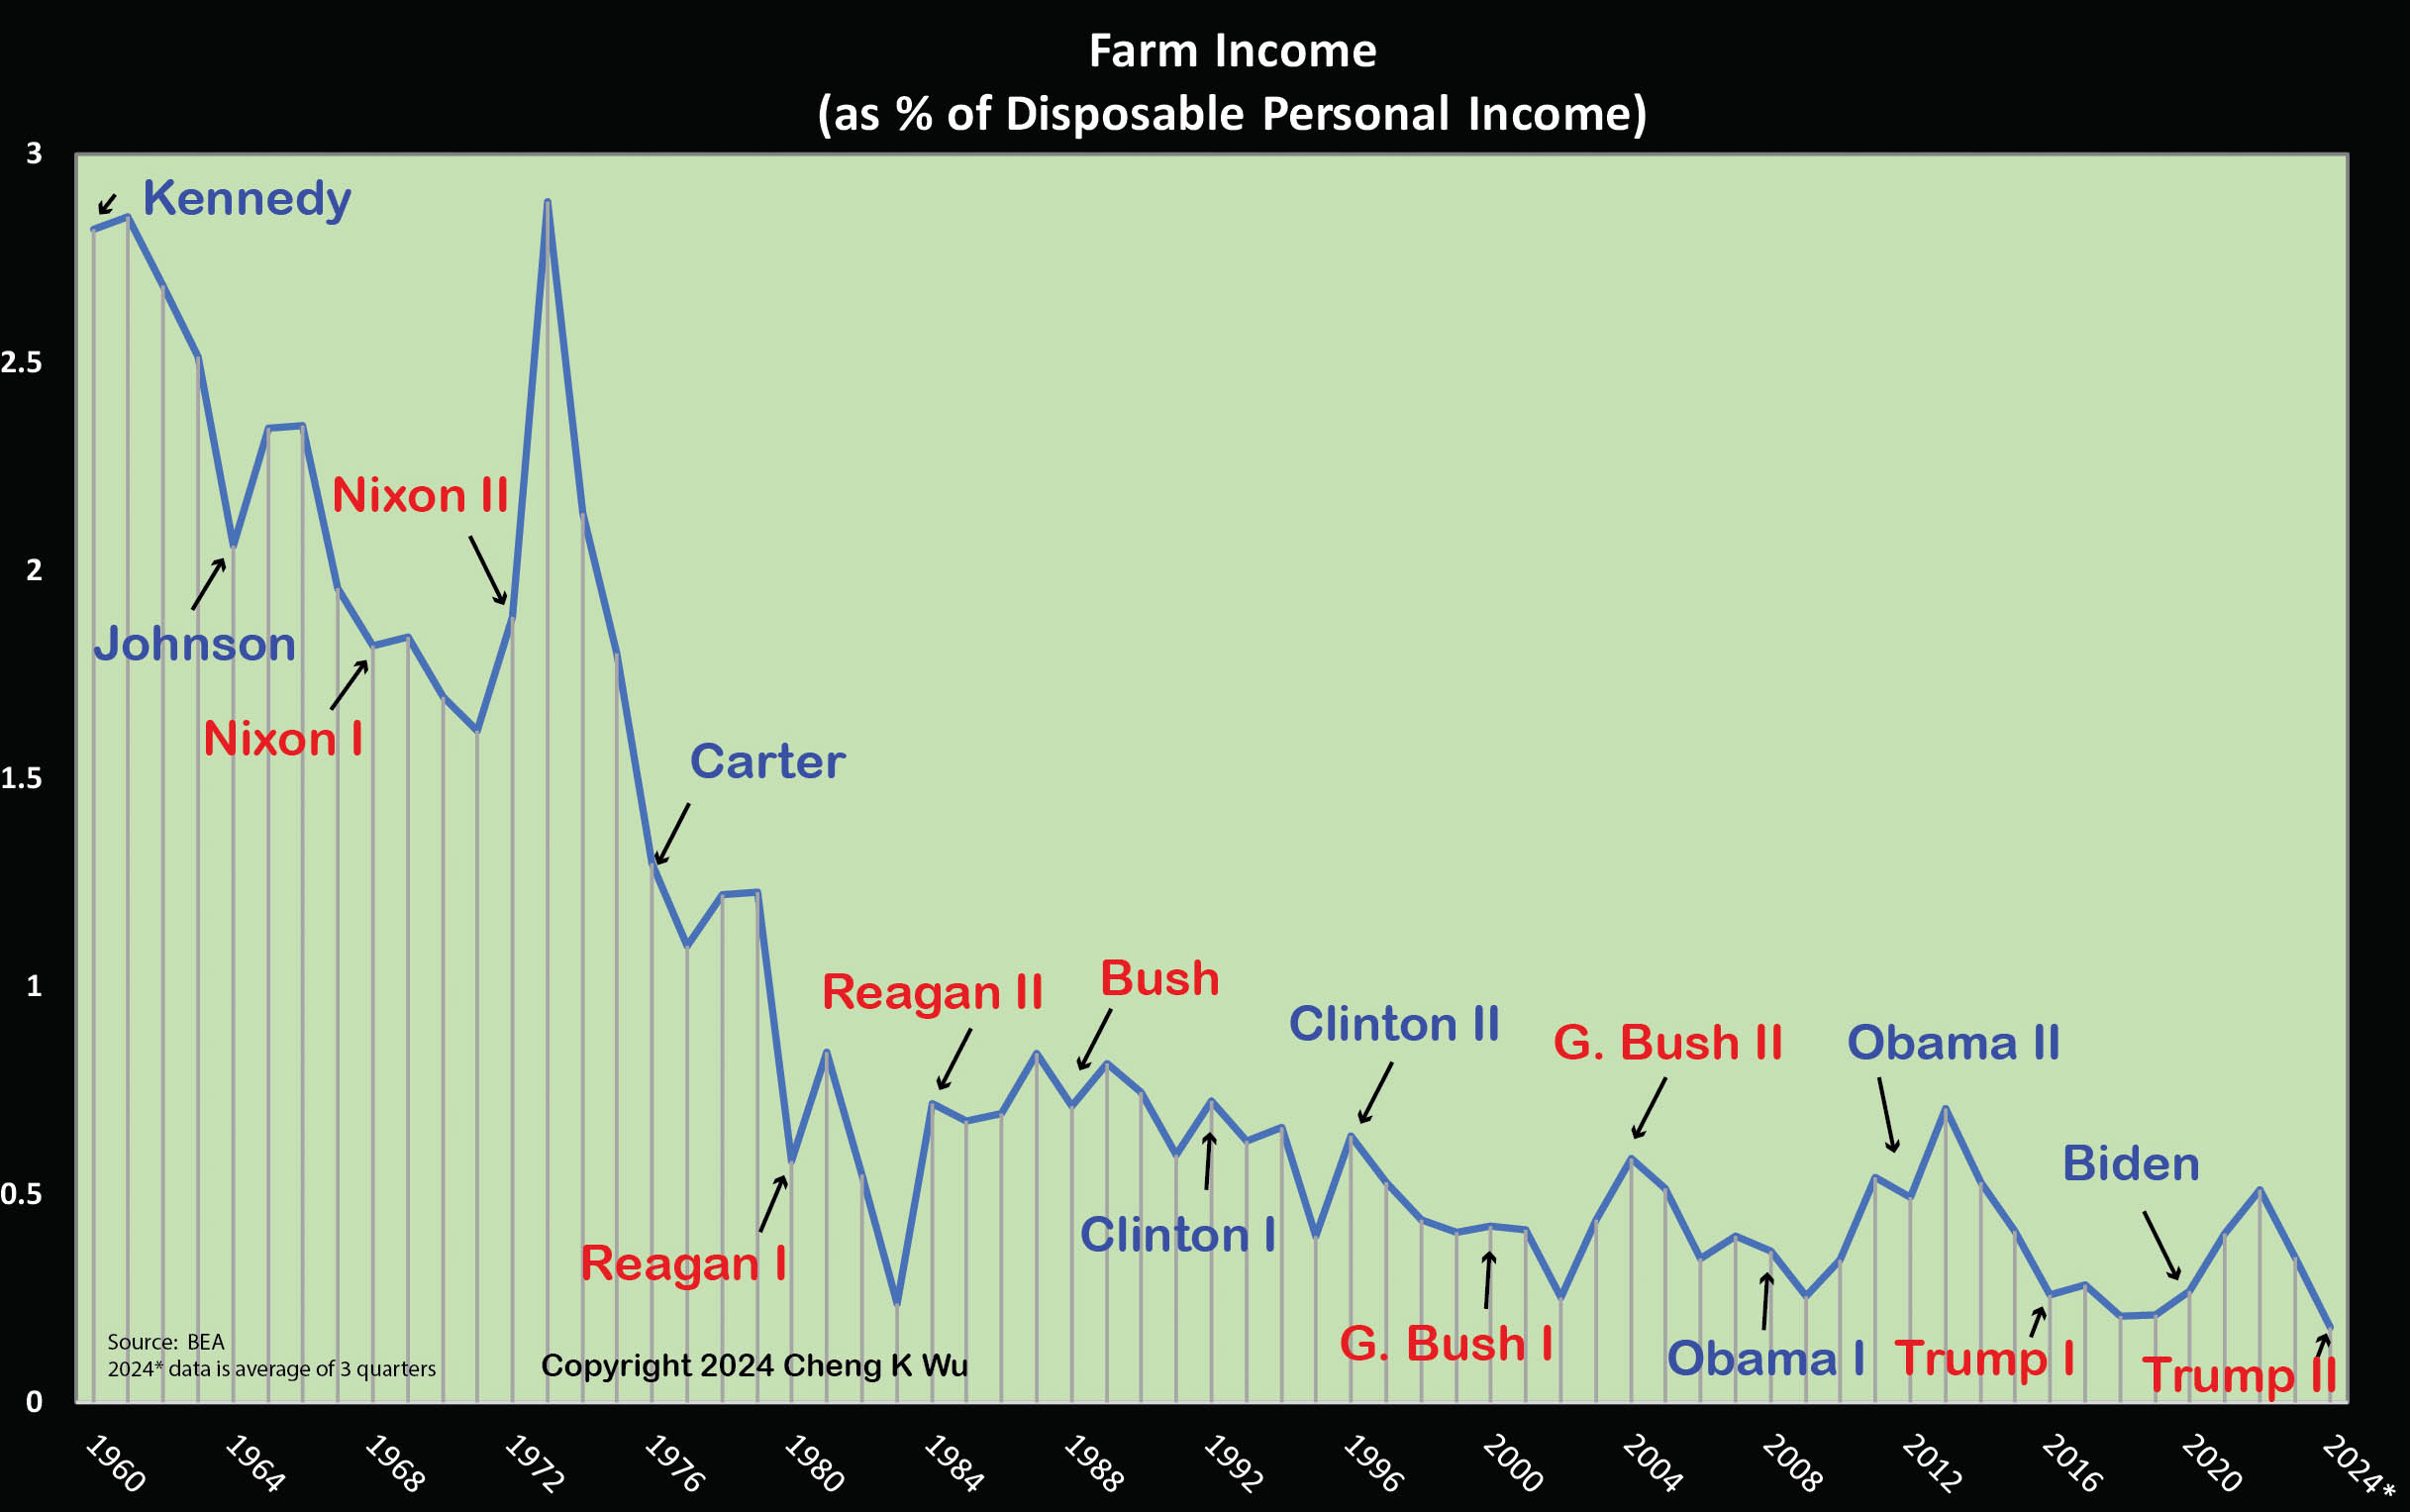
From 1959 to 2024, the chart below confirms that, with two exceptions (Johnson and Clinton II), when farm income drops there is a shift in presidential election, independently of the president (or party) in power. (Johnson election may have been affected by Kennedy’s assassination. Clinton II had strong farm partial recovery in first two quarters of 1996.). Note that in 2024 (for first three quarters), farm income as percentage of disposable personal income reached the lowest level in the last 65 years. In all likelyhood, any Republican presidential candidate, even J.D. Vance, would have won the election of 2024.
Wu, Cheng (2024): "Consumption Theory and Why Any GOP Candidate, Including J.D. Vance, Would Have Won the 2024 Election: Comment and Update to the Original Paper of 2016" (“Economics and How Obama Could Have Lost the 2016 Election Too”). https://mpra.ub.uni-muenchen.de/122718/
_______________________________________________________________________________________________________________________________________________________________________________________________________________________________________________________________________
Google Gemini on my 2 election articles:
How Wu applies this specific growth-based savings function to predict US election outcomes?
Cheng K. Wu applies his theory to elections by framing the vote as a "consumption decision"—specifically, the purchase of a presidential administration's services.
In standard political science, voters simply punish bad economic performance (economic voting). Wu’s specific contribution is the mechanism of that punishment: it is triggered by the "Feedback Optimization" mandated by his savings theory.
Here is how the growth-based savings function predicts election outcomes:
1. The Mechanism: "Re-Optimization" via Savings
In Wu's model, voters (consumers) start a 4-year term with an expected income growth rate. They optimize their life (consumption and savings) based on this expectation.
- The Trigger: If realized income growth is lower than expected, the consumer cannot simply smooth their consumption (as standard theory suggests). Instead, they suffer a "shock" to their savings.
- The Consequence: This violation of their budget constraint forces them to enter a "second round" of decision-making (the Dual-Decision Hypothesis).
- The Vote: This "second round" is the election. The voter must "re-optimize" by firing the service provider (the incumbent party) to restore their utility equilibrium.
2. The Key Variable: Farm Income
While Wu's general theory focuses on labor income, his election-specific model isolates Farm Income as the critical predictor.
- Why Farm Income? Wu argues that while labor income drives the national economy, the U.S. Electoral College gives disproportionate weight to rural/farm states. Therefore, the "feedback optimization" of farm voters determines the swing states.
- The Metric: He tracks Proprietors' Farm Income as a percentage of Disposable Personal Income.
3. The Prediction Rule
The rule is binary and deterministic based on the direction of the growth variable:
| Economic Scenario | Savings Impact | Voter Action (Feedback) | Election Outcome |
| Income Growth ↑ | Savings accumulation meets/exceeds target. | No need to re-optimize. Keep current provider. | Incumbent Party Wins |
| Income Growth ↓ | Savings are depleted/unexpectedly low. | Must re-optimize. Fire current provider. | Incumbent Party Loses |
4. Recent Case Studies (According to Wu)
Wu has applied this retrospectively and prospectively to recent elections:
- 2016 Election (Clinton vs. Trump): Farm income declined significantly under the second term of the Obama administration. Farmers/rural voters experienced a "savings shock" and re-optimized by switching parties.
- Prediction: Incumbent (Dem) Loss.
- Result: Trump (GOP) Wins.
- 2020 Election (Trump vs. Biden): Farm income volatility and decline (exacerbated by trade wars/pandemic) meant the growth target was missed.
- Prediction: Incumbent (GOP) Loss.
- Result: Biden (Dem) Wins.
- 2024 Election (Harris vs. Trump): Wu’s papers (specifically MPRA Paper 122718) noted that farm income growth was negative/declining leading up to 2024.
-
- Prediction: Incumbent (Dem) Loss.
- Result: Trump (GOP) Wins.
Summary
The "growth-based savings function" is the mathematical justification for why voters switch sides. They don't switch just because they are angry; they switch because failed income growth mathematically forces a reduction in savings, compelling a "re-optimization" of their choices to protect their future utility.